


Unleash the power of AI to revolutionize data analysis.
ChatGPT, built on the innovative GPT-4 architecture, takes complex data tasks and simplifies them into just a few keystrokes. This trailblazing Advanced Data Analysis or a Custom GPT assistant allows you to directly upload data for lightning-fast coding and testing. ChatGPT-4 Turbo is not only about speed; it’s about completely changing how we approach data science. With unrivaled structured data capabilities, it stands at the forefront of innovation, giving premium users the tools to dive into analysis with new levels of accuracy and efficiency.
The magic of ChatGPT is its sheer versatility. From planning to preprocessing to full-on web app development, it’s designed to supercharge productivity and smooth workflows. It’s a game-changer for anyone looking to harness the power of their data, with enhanced visualization, error-checking, and outlier detection. Imagine a partner that not only processes your data, but visualizes it in ways both comprehensive and comprehensible. ChatGPT is more than just software – it’s your guide through the data-driven landscape of the modern world. Unlock its potential, and revolutionize how you analyze.
Key Features and Takeaways:
- Advanced Data Analysis: Allows direct data uploads for writing and testing code.
- Enhanced Productivity: Ideal for project planning, data preprocessing, and model selection.
- Data Visualization: Capable of processing and visualizing data efficiently.
Pros:
- Streamlines complex data analysis tasks.
- Offers higher-speed access and longer context windows for processing inputs.
Cons:
- Limited to premium users.
- May require a learning curve for optimal utilization.
In conclusion, ChatGPT, with its advanced GPT-4 architecture, represents a significant leap forward in the realm of data analysis. It provides an intuitive platform for users to upload, process, and visualize data, transforming complex analysis tasks into manageable, insightful experiences. Its capabilities extend from basic data handling to sophisticated project planning and model tuning, making it an invaluable asset for both novice and expert data scientists. While its full potential is unlocked with a premium account, the breadth and depth of its features make ChatGPT a formidable tool in the ever-evolving field of data science, offering a blend of efficiency, accuracy, and user-friendly interaction.

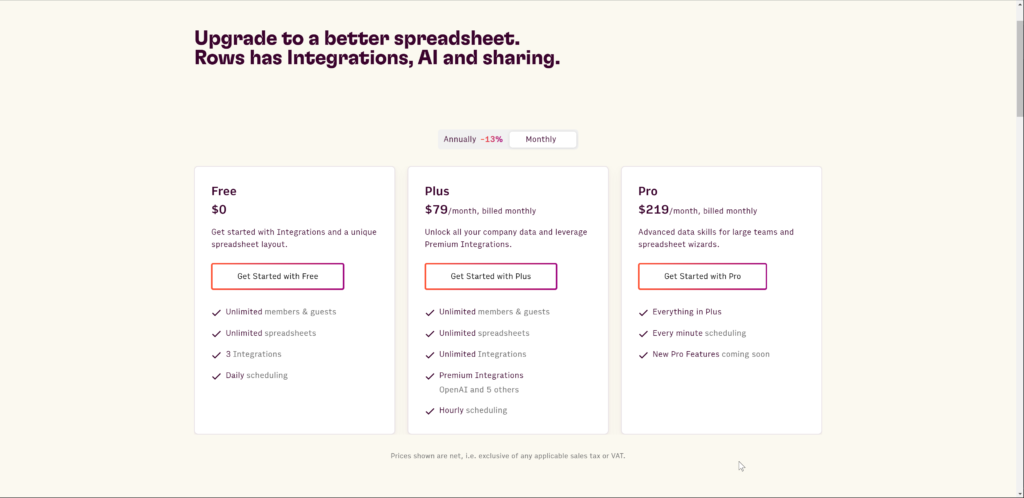
Unleashing the Power of AI in Spreadsheets
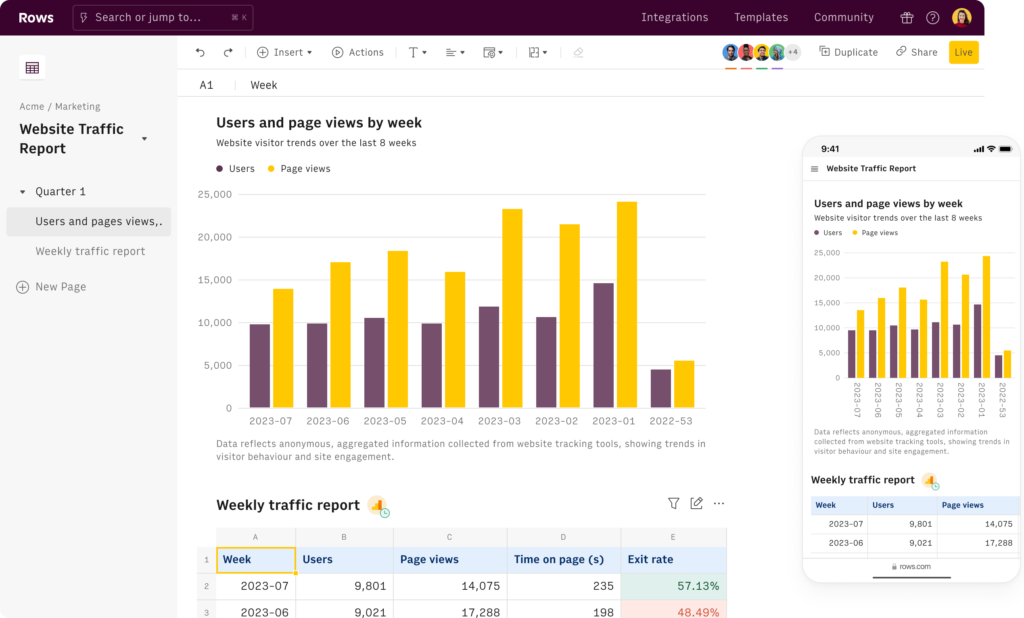
In the era of big data, the demand for tools that can simplify and streamline data analysis has never been greater. Enter Rows, a platform that redefines the traditional spreadsheet, integrating the power of AI to transform the way businesses handle data. Rows isn’t just another spreadsheet tool; it’s a groundbreaking innovation designed for the modern data-driven world. It’s tailored for founders, data analysts, and anyone who requires deep insights into their data, offering a unique blend of familiar spreadsheet functionalities with advanced AI capabilities. This is where complex data analysis becomes accessible, with Rows’ ability to perform cohort analyses, financial reports, and much more, all within an intuitive spreadsheet environment.
Rows is more than just a spreadsheet; it’s a data analyst’s dream come true. At the heart of Rows’ functionality lies the AI Analyst, a feature that utilizes advanced AI technology to summarize, analyze, and answer questions about datasets directly within the spreadsheet. This tool is not just about processing numbers; it’s about understanding them. With the ability to scan datasets, identify key variables, and provide summaries with relevant KPIs, Rows AI Analyst turns data into insights, making it a potent tool for any organization looking to harness the power of their data.
Key Features and Takeaways:
- AI Analyst: A standout feature, the AI Analyst is available in every table of a spreadsheet, enabling users to summarize, analyze, and answer questions about their datasets. This function brings a new dimension to data analysis, allowing for quick insights, deep dives, and custom questions.
- Quick Insights: Automatically generates summaries and key metrics from tables, providing a high-level view of the data with the option to copy insights or formulas for further analysis.
- Deep Dives: Offers more in-depth analysis by extracting trends, generating pivot tables, and identifying patterns, which can be added to the spreadsheet for further exploration.
- Custom Questions: This feature allows users to ask specific questions about their dataset, enabling the generation of tailored insights and deep dives. It’s a powerful way to interact with data and extract precise information.
Pros:
- User-Friendly Interface: Rows presents a familiar spreadsheet environment, making it accessible even to those who are not experts in data analysis.
- Advanced AI Capabilities: The platform’s AI Analyst feature offers a significant advantage by automating complex data analyses and generating actionable insights.
- Flexibility and Creativity: Users can creatively use the AI Analyst for various purposes like generating pivot tables, excluding irrelevant data points, and removing outliers.
Cons:
- Preparation Requirements: To effectively use the AI Analyst, specific conditions must be met, such as proper table setup and unique header names.
- Still in Beta: The AI Analyst feature is still in beta, implying ongoing development and potential limitations in its current capabilities.
Conclusion
Rows emerges as a pioneering tool in the realm of data analysis, particularly for those who seek to leverage AI’s power in a familiar spreadsheet format. Its AI Analyst feature is a game-changer, offering insights and analyses that go beyond traditional spreadsheet capabilities. While it requires a proper setup and is still evolving, its potential to revolutionize data handling and decision-making is undeniable. For modern businesses and data enthusiasts, Rows represents the future of data analysis—a future where insights are just a few clicks away.
Elevating Business Intelligence with Appy Pie’s Analytics
In a world where data reigns supreme, Appy Pie emerges as a vital tool, equipping businesses with powerful app analytics. This platform isn’t just about tracking app downloads and user ratings; it dives deeper into the nuances of app performance. With its AI Analytics App Builder, Appy Pie empowers users to create tailored analytics apps, including digital analytics, business intelligence, and social media analytics apps. This functionality is crucial for anyone looking to gain a comprehensive understanding of their app’s performance across various parameters. Appy Pie doesn’t just provide data; it offers insights into audience behavior, engagement, and conversion analysis, making it an indispensable asset for businesses striving to understand and improve their app’s performance.
Appy Pie stands out for its ability to transform complex data into actionable insights. The benefits of its app analytics extend far beyond basic metrics. It provides data-driven insights into user retention, enables the collection of precise data to better serve customers, and drives ROI across all performance phases. Additionally, it facilitates customer-focused and personalized marketing, allowing users to track both group and individual achievements from marketing campaigns. This level of detail in analytics enables businesses to optimize their strategies and better understand their customers.
Critical Review of Appy Pie
Key Features and Takeaways:
- Comprehensive Analytics Capabilities: Appy Pie offers a broad spectrum of analytics features, including audience analysis, engagement analysis, and conversion analysis, making it a comprehensive tool for app performance evaluation.
- Data Visualization and Tracking: The platform includes data visualization features with templated and custom reporting forms and interactive dashboards. It also provides robust tracking for every activity within mobile apps.
Pros:
- User Profiling and Segmentation: Appy Pie excels in segmenting users based on various criteria like region, behavior, and demographics, offering a granular view of the user base.
- Measurement of Engagement: It measures app engagement both by user and feature, enabling a detailed understanding of how users interact with different aspects of the app.
- Enhanced Business Intelligence: With features like customer funnel analysis, Appy Pie helps businesses view marketing funnels and customer journeys, enhancing the decision-making process.
Cons:
- Potential Complexity: The depth and breadth of features might be overwhelming for new users or small businesses with limited analytics experience.
- Dependence on Digital Ecosystem: The full potential of Appy Pie is best realized when used within a comprehensive digital ecosystem, which might require additional investment in technology and training.
Conclusion
Appy Pie positions itself as a key player in the realm of app analytics, offering businesses a detailed and nuanced view of their app’s performance. Its suite of features, from data visualization to user profiling, equips businesses with the tools they need to make informed decisions, enhance user engagement, and drive growth. While the platform’s comprehensive capabilities might pose a challenge for beginners, its potential to provide deep insights makes it a valuable asset for any organization looking to leverage data for success. For those ready to dive deep into the world of app analytics, Appy Pie offers a pathway to enhanced understanding and strategic decision-making.


| Criteria | ChatGPT | Github Copilot | Rows.com | MS Excel | Appy Pie |
|---|---|---|---|---|---|
|
FREE OPTION |
Yes |
Yes |
Yes |
Trial – 1 Month |
Trial – 7 day |
|
COST |
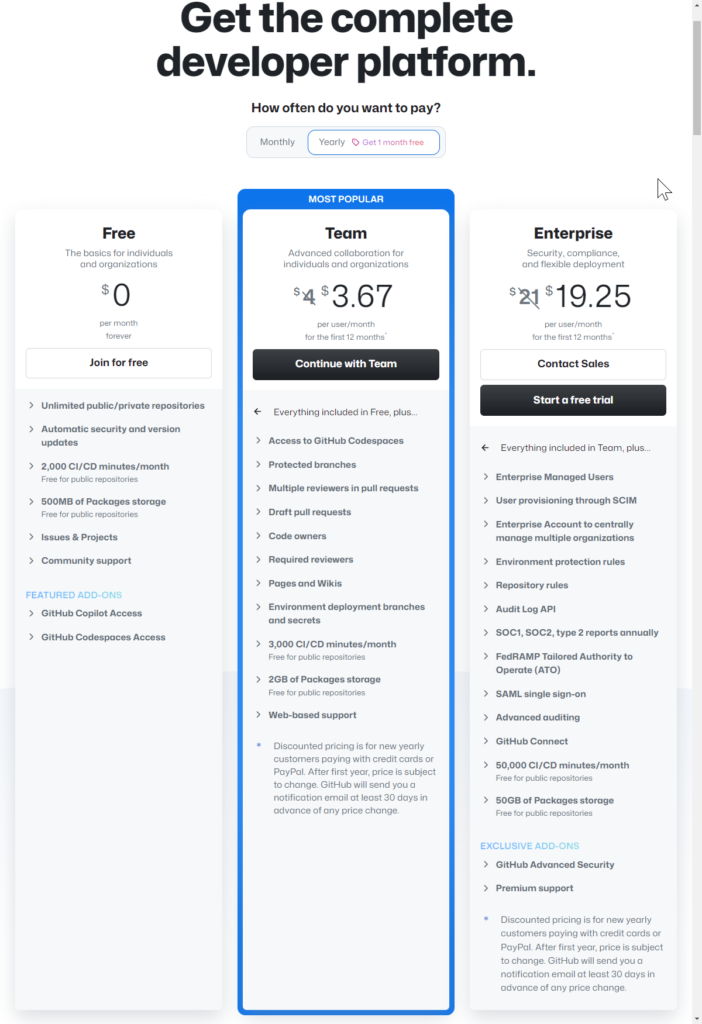
$20/month Plus |
$3.67 – $19.25 (annual) |
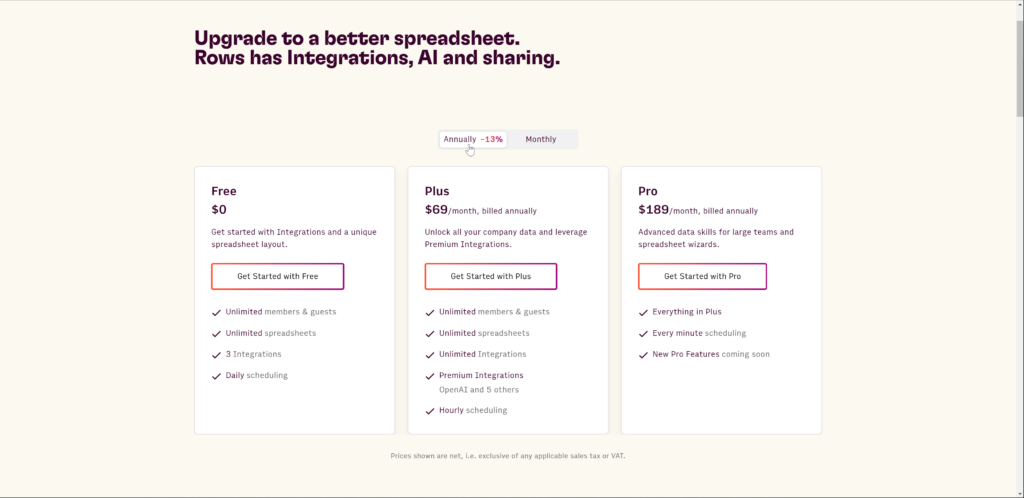
$69 – $189 (annual) |
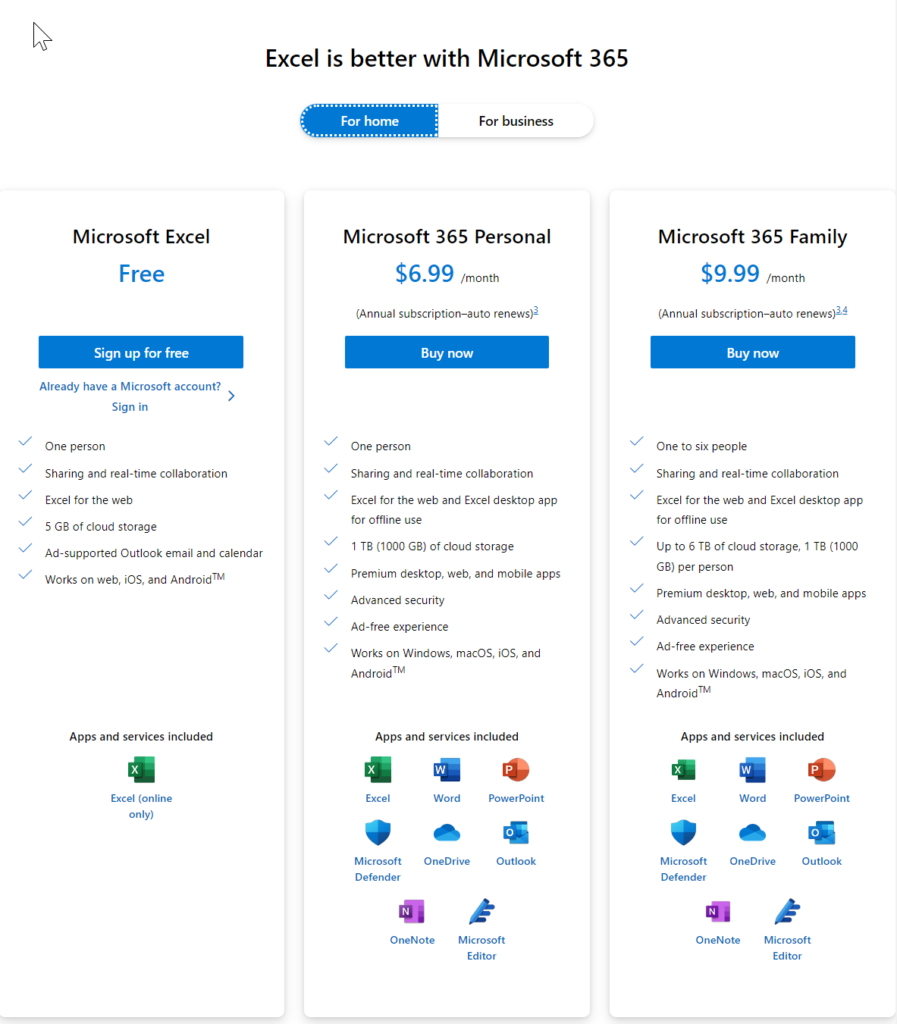
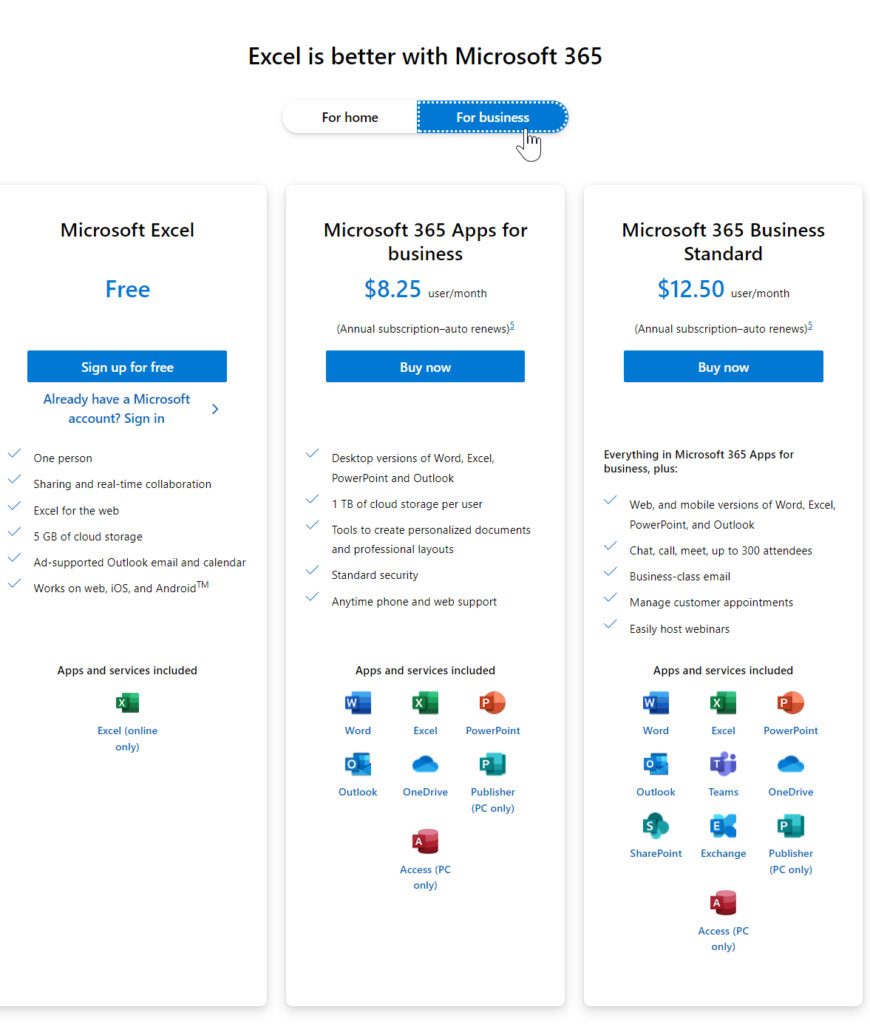
$6.99 – $9.99 (personal) |
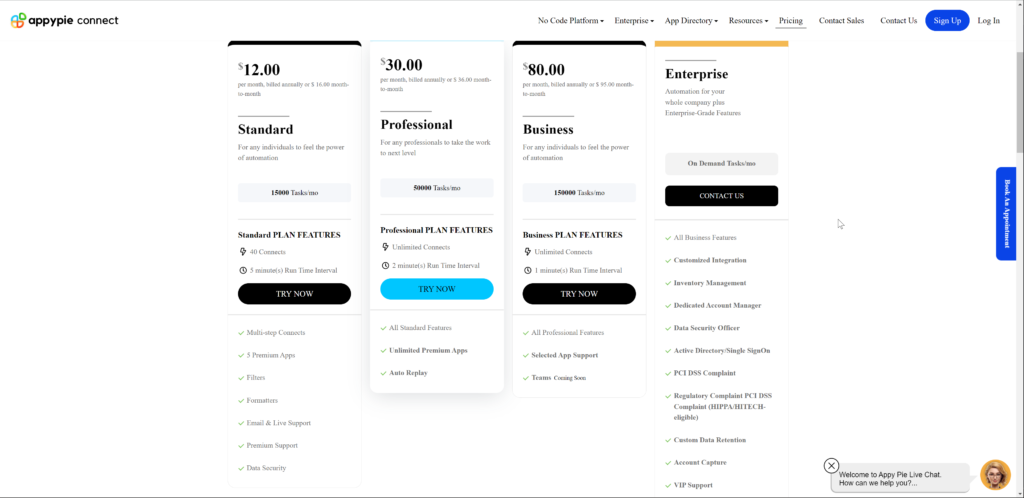
$12 – $80 (annual) |
|
BEST FOR |
General Public |
Pro Data Scientists |
Statisticians |
General Public, |
Automation Specialist, |
|
Scalability |
No |
Yes |
Limited |
No |
Yes |
|
Data Visuals |
Yes |
Yes |
Yes |
Yes |
Yes |
MONSTER |
|
|
|
|
|